This was meant to be a short Facebook posting for Labor Day 2017. Unfortunately, I was … err… working on Labor Day (fieldwork – got to ‘make hay while the sun shines’) and the blog rather outgrew the Facebook format. It remains a bit shallow for a true blog, but here it is!

Happy Labor Day – 1893.
In 1893, the celebration of Labor Day in New York was barely a decade old. We happened to stumble across the County’s labor statistics for that year and so now, 124 years later, in belated honor of Labor Day 2017, we present a brief glimpse of the County’s labor profile at that time.
As background, in 1890 the County had a censused population of about 45,557, with 51% women and 49% men. The workforce, having begun the century with a large majority of people working in agriculture, was now shifting more towards employment in manufacturing and services/retail. Although I don’t know how it played out in the County, ‘The Panic of 1893′ was a period of significant economic decline, with national business output estimated to have dropped about as much as during the Great Depression of the 1920s.

The County’s 1893 employment profile contains some intriguing tidbits – Hudson had one billiard room keeper, a Canadian in his forties; Copake had one gardener, an Irishman in his 50s; and one harness maker, a Dane in his 30s. Out of New Lebanon’s 187 farmers, only one was Afro-American and two were women. The entire County had two professional actors, one American man and one English woman, but eight professional photographers. There were more watchmen (18) than policemen (11). The county employed 61 cigar makers and three professional “billposters” but only one butler, one piano maker, one trapper, one lighthouse keeper, one gunsmith, one iron miner (a Swiss), one frescoer (a German) and one button maker (a woman).
Of the 14,541 people reporting their occupations, about half were either farmers or “laborers”, split almost equally between those two occupations. Each remaining profession accounted for less than 5% of the total work force. About quarter of all jobs could be described as some type of manufacturing (not including “laborers”), roughly 15% were in retail and services, 4% appeared to work as home/garden help of some sort, while a bit over 3% had jobs relating to transport (e.g., RR, shipping or other cargo movement). Teachers accounted for 1.4% of the jobs, and today’s ‘healthcare workers’ (i.e., physicians, druggists, dentists and nurses) totaled just over 1% of the workforce.
Only 14% of the official workforce were women, although they slightly exceeded men in the total population. (Obviously, many women were working very hard at tasks that were not, at that time, considered in tallies of labor statistics.) Women were, not surprisingly, unevenly distributed across the official professions. All reported dressmakers, milliners (aka maker and/or seller of women’s hats), seamstresses, and housekeepers were female, along with more than 99% of the domestics. Together, these jobs accounted for more than 40% of the women in the official workforce. Women also predominated in the professions of shirtmaker, cook, nurse, laundry worker, looper (a role in the manufacture of clothing), waiter, boarding house keeper, and teacher. However, several of the most common jobs were shared, at least in coarse categorization, with men. These included the well-populated jobs of machinery/equipment operator and mill employee. While women were not the majority, they were commonly working as artists (albeit only 15 people in the County listed themselves as professional artists), weavers, students, tailors, and telegraph operators. Finally, there were a few professions were men dominated, but women did appear, such as bookkeepers and clerks, bakers, merchants, farmers (out of 3290 farmers in the County, 70 were women). There was also one female physician and one female lawyer. The most common all-male jobs were “laborer”, carpenter, railroad worker, painter, blacksmith, butcher, teamster (e.g. ox driver), and mason, in that order. There were at least 45 other somewhat common professions which were also male-only.

In terms of race, respondents were tallied as either “white” or “colored”. I believe most or all of the 344 “colored” people were Afro-Americans, although I am unsure how some other ethnicities would have been recorded. Chinese people were, apparently, considered “white”. The most common jobs for “colored” men were, in decreasing order, laborer (accounting for two thirds of all “colored” males in the workforce), butcher, farmer, hostler (one who took care of horses, often at inns), coachman, waiter, porter, cook and barber (of which there were five). “Colored” people were absent from most remaining professions, although they were also recorded in such jobs as clergyman, papermaker, fruit grower, carpenter and builder. “Colored” women were mostly employed as domestics, with a few also working as cooks, laundry women, housekeepers, and waiters.
Jobs also differed among nationalities. A total of around 2,350 respondents were not American citizens. The most common foreign nationalities were, in order, Irish, German and English, accounting for more than 80% of the non-native workers. Poles, Canadians, Russians, Scots, French, Swedes and Italians rounded out the top 10 nationalities. (Today, Germany, Jamaica and Poland are the County’s most common non-US countries of birth in the full population.) The most likely jobs differed somewhat amongst nationalities. For all except the Russians, laborer was the most common job; peddler was the most common Russian profession (followed by laborer). Farmer was often the second most likely job, although there were no Russian, Polish or Italian farmers recorded. In some cases, certain jobs seemed especially common for specific nationalities. These included Russian tailors; Irish cooks, policemen, saloonkeepers, and furnacemen; Chinese laundry workers (which was the only job recorded for Chinese men in the County); Polish mill operators; German bakers, butchers, shoemakers, and tailors; French wood choppers; and English spinners and brewers.
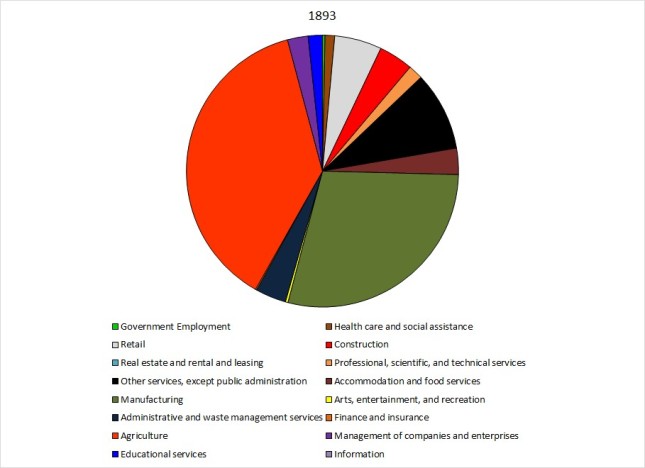

Comparative pie graphs of workforce composition. 1893 data is from the Eleventh Annual Report of the Bureau of Labor Statistics of the State of New York (1894) and 2011 data is from U.S. Bureau of Economic Analysis.
I have not had time to do a detailed comparison with the modern workforce, but in 2011, the total workforce in the County was 32,161 (out of a population of about 62,000). As shown in the pie charts above, times have changed. For example, in 2011, only 3% of workers were in farming, while in 1893 that number was probably closer to one third (exact values are difficult to determine because “laborer” likely included jobs in both agriculture and manufacturing – in the figure I split laborers half/half between these two categories). Manufacturing likewise was substantially more important in 1893. Conversely, health care, which accounts for about 15% of the workforce today, officially made up only a bit over 1% in 1893. Government and retail jobs also seem noticeably more common today (although “government” is underestimated in my 1893 tally – I could not determine all the jobs which were governmental). The sex ratio of the officially surveyed workforce is much more equal today with about 52% male and 48% female.
We made the graph below several years ago from a slightly different data set, but, in closing, I think it serves to put the historical and modern data in general perspective. In 1893, as for almost the entire period between 1850 and 1950, the official County workforce was roughly equally divided between agriculture, manufacturing and retail/services (i.e., many of the remaining professions). Today, retail/services (including healthcare and civil service) predominates. This may make us less self-sufficient as a society, but may mean greater social care (e.g., health, fire, police and other such services) and, perhaps, greater buffering from local or regional impacts on food or production. It would be interesting to compare this graph to that of so-called ‘developing countries’ which are transitioning economically. But that is definitely beyond the scope of this posting!
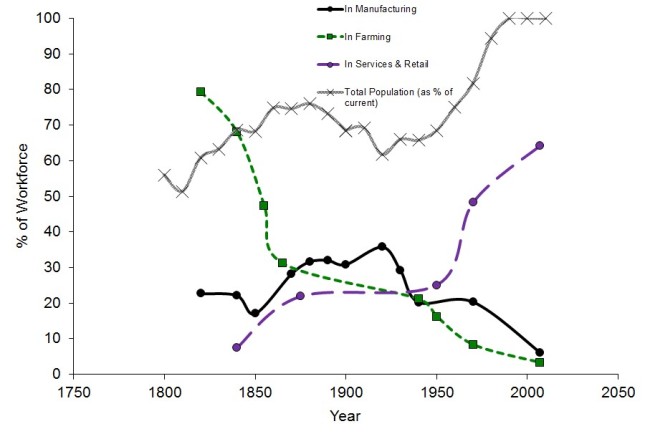
A rough illustration of the composition of the Columbia County workforce over time from state and federal census data. Various assumptions are made in classifying historic jobs, but general patterns should be more or less accurate.